

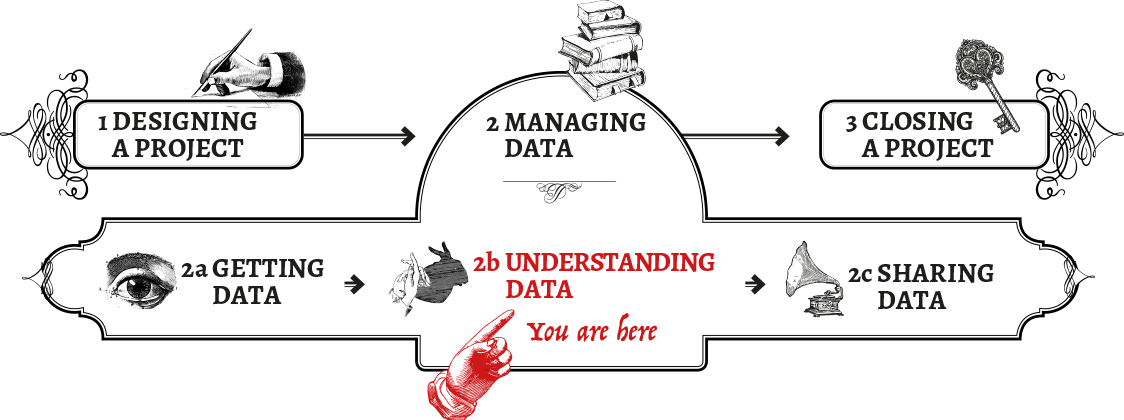
Understanding Data
cleaning, preparing, and verifying data

Verifying & Cleaning Data
In a perfect world your data would live in neat boxes, tagged, categorised and compiled, ready for perusal and analysis. Unfortunately, real life data collection is often messy, disorganised, uncategorised, jumbled and knotted. We might, for example, have online surveys with manual input, where the surveyors enter slightly different definitions of the same thing, making it impossible to clearly categorise, even if the two data points should clearly belong together.
Or, you might have a situation in which thousands of hand-written surveys are transcribed by dozens of volunteer college students, some of whom skipped a letter or a number here and there. The situation becomes even worse when the project involves collation and aggregation of already existing data sources, where we don’t have complete knowledge of the methodology, or the data is provided in badly formatted files.
Verifying Data
Why is this important in the responsible data perspective? Ensuring the data you have collected is properly verified is vital. Without verification, the results cannot be relied upon for decision-making processes, and you risk misrepresenting or doing harm to the populations you aim to help.
Verifying data when you’re close to the source
Integrity: Examine the raw data before doing anything to manipulate it. This usually includes making a complete backup of the original material, which is kept separate from any other activities (though it doesn’t prove that the data has not been manipulated before reaching the storage location). This can be vital at a later stage for ensuring accuracy, for availability (in case of accidental deletion) and for responding to accusations of manipulation, for example in a court situation. A number of methods are available to check that data has not been manipulated, depending on the method of data collection and storage. Working with paper, it is often better to work with photocopies or scanned images, while keeping the originals secure elsewhere.
Similarly, when working with digital data, you can:
-
Backup an exact copy. For example, using disk imaging software
-
Verify you are using an exact copy of the original. For example, using file verification techniques
For more on data integrity, please see the Data Management section of A Home for Healthy Data.
Go back and ask: Reach out to a small sample of the surveyed population for more in-depth analysis. This requires that in your collection efforts you have the ability to take and securely store data about the people you survey in order to contact them again (assuming it is safe to do so). If the initial group was part of a small qualitative research project, you might scale up through a more quantitative questionnaire to support your first research.
If you are close to the data collector, it may be possible for you to identify trends in the data and verify with the data collector. For example, if you see for a month there were 50 new data submissions, ask the data collector if that number feels right. Another example, if you see some odd data patterns, you may be able to trace that data back to the original collector to ask them to explain how that data came about.
Verifying data without the source
There are times where you are verifying data where you don’t have access to the data collector/originator.
Cross-checking: If there are other data available about the same subject, look at how they compare. Do they reach the same outcome? Depending on the type of medium you have collected data with (video, photo, paper, etc), there are a number of techniques for remotely cross-checking the data. For example, with video footage, this can include:
Examining the extra metadata also captured in the data - such as time, location, camera type, length, resolution etc. The content itself - such as: Is it possible to match location features such as roads, terrain etc. seen in the footage with other images like satellite photos, maps, regular photos? Is it possible to match identifying information such as building signage with other information on the area? Is the activity viewed or heard in the data validated by other information sources such other reports, social media, newspapers etc. For further techniques, see The Verification Handbook and the Citizen Evidence Lab.
Cleaning Data
Before moving further, we need to clean the data and prepare it for use by aggregating, filtering, reconciling and standardising our data and metadata.
Messy data may hide harmful information. If we don’t make sure that we can clearly name, describe and recognise all the information contained in data sets, we might make improper assumptions about the risks that that data might pose. There is something to be said about having a bird’s eye view of an entire data set that is organised and filtered, as opposed to trying to make sense of different points that are strewn in different directions. Gaps and assumptions come to the fore much more clearly after creating some order.
There are some very good sources available for learning what tools are out there, and how to use them: School of Data, for example, has a number of tutorials for data cleanup. From the School of Data - Data Cleaning course: cleaning data can mean a number of different things, including:
-
finding and removing unwanted bits of data in spreadsheets
-
formatting data correctly for the tools you are using
-
dealing with inconsistencies in the data
-
structuring it so it can be used effectively for what you want it to do
Human Resources:
The ability to efficiently manage large data sets is a science, and people qualified to do so are aptly (albeit not creatively) called data scientists. This person should have enough spreadsheet savvy to easily merge, filter and pivot complex data. It might be that your best solution is to hire a data scientist, or partner with an NGO that has in-house data science expertise. In any case, your project will benefit from you and your team gaining a firmer grasp on what procedures exist, and what can (or cannot) be done to clean up your data set.
Filtering for the greater good Any data set can be described as a list of data points that are somehow related to one another. Usually these relations are described through two dimensions, because we visualise them on paper sheets or computer screens, both having only two axes: height and width. To make it simpler, imagine a spreadsheet: rows and columns are the two ways, or dimensions, that we have to relate and connect information. If a row represents one data point, like information about a high school teacher in Kenya, the columns will vertically categorize different types of information we have about all the teachers in the spreadsheet, like place of employment, salary, spoken languages, course taught, number of times the teacher has been absent in the last year, etc. Our goal with the data cleanup is to make sure all these categories show information that is relatable.
Filtering is usually the first step in checking data for consistency. Filtering creates a menu-like list of data aggregates present in a column, that lets you choose to visualise only rows with specific content in that column. Tools like Microsoft Excel, Libre Office Calc, Apple Numbers or Google Sheets all offer strong filtering functionalities. A first filtering round will already offer an overview of how much the data set is comparable and where the main need for cleanup lies. This is a hassle-free, accessible first step for you to understand more about your data on a very general level, as having a clearer overview is useful to understanding how to move forward.
For more advanced data cleanup, Open Refine offers powerful ways to combine, compare and reconcile your data. Open Refine lets you combine and aggregate slightly differing types of data using algorithms that assist with “fuzzy” comparisons of not-quite-equal information. It also lets you execute faceted search on your data: a search combining multiple different filters and data points as facets.
For more in-depth information about data cleanup, visit “A gentle introduction to cleaning data”, as well as “A gentle introduction to exploring and understanding your data”.
Preparation: describing your data
A complementary aspect of data cleanup is making sure the information that has been collected is fully and exhaustively described. Describing information means documenting and collecting information about information, also known as metadata (data about data). Typical metadata content types might be “date collected”, “identifier”, “size of picture”, “format type” etc. When preparing the data set for analysis, look into all the metadata you might have that describe your data set and make sure they are documented.
While a great part of the description process will be directly connected to the data gathering phase, there are additional data points that can be defined during the preparation phase. Some might be automatic, like pulling metadata (timestamps, authors, file sizes etc) out of documents. Other might require manual work, like categorising by theme, type of response, etc - any information that might be helpful in the analysis phase.
Formats and standards
Data can be described in many ways, and saved in a myriad of different file formats. It is smart to adopt common standards and file formats for the data, so that they can be more easily shareable, more resilient (future-proof) and also comparable with other data sets; or, interoperable. One example of a standard file format is the comma-separated value format (or .csv) for spreadsheets. While each spreadsheet software has its own proprietary file format that usually also provides additional software-specific functionalities, the .csv has the strength of being shareable across platforms, and a strong open description of its formatting so that the data lives in a format that can be adapted to other purposes. Having the data live in a proprietary file format like .xls might mean that one day the company that owns it stops supporting it, the data set becomes unusable, and the knowledge is lost.
Managing Bias & Assumptions
Can I trust what my data set is telling me?
At this phase, you have already collected your data, cleaned it up, described it and standardised its formats and inputs (if you haven’t, you might want to have a look at the previous chapter on verifying, cleaning, and preparing your data). Your data set is begging to be analysed. It might be chock full of interesting informational clues that you can’t wait to pull out and present. You have a distinct feeling that the data set you have is going to answer your questions: more importantly, you are pretty sure it will give you the answers you want.
But wait! Before analyzing your data, this is the right moment to examine your assumptions (and those of others) about the data set. There are numerous pitfalls when trying to answer questions from data. In this chapter we will discuss various challenges that may arise when looking into the collected data. The optimal situation would be that these considerations have already been made during your design phase, but in real life you are often faced with data already collected by someone else, leaving you to make sense of it. We aim to cover both situations here.
This chapter explores the following questions:
-
How do I make sure my data is accurate?
-
How can I make sure I understand what accurate means?
-
What are responsible ways to remove noise from my data?
-
What is causation, and when can I talk about it?
Making sure your data isn’t biased
All data, no matter how it is collected, will contain a certain amount of bias. It is your task to analyse what those biases might be, to minimise them to the extent possible, identify the ones that cannot be removed, and make sure that persistent biases are well known and explicitly flagged throughout the research. Throughout the data cycle you should keep a keen eye on eliminating as much bias as possible.
Bias is the tendency of results to favor a certain outcome, due to the implicit construction or logic of the collection or processing of the data, the way that the data was collected (setting, sequence of questions) and the way that the data is analysed. Below we will address some specific points that are useful for spotting red flags in your data.
Some data is collected using a sample of the universe or total population, on the basis of which we make generalisations about the phenomenon. Being aware of sampling bias, how it impacts analysis and limits what we can say about the overall population is important. Was your sample sufficient to allow for certain types of conclusions? Did it bias your analysis and findings in any way?
In the planning and design phase, bias can be introduced when focus issues and topics are selected. In the data collection process we can have response bias due to the phrasing or sequence of the questions asked or the setting of the data collection site. One issue is cultural bias, where some answers are more socially desirable than others, and may skew the result.
You should take special care if you are working with comparative data: differences in collection techniques, or even differing definitions, might seriously skew your results. If, for instance, you are collecting and comparing data on sexual abuse between several countries (or even provinces) terms like assault and rape might have very different definitions in different places. These differences grow larger as language and culture differ.
Consider testing for data collection bias in your results. Often results may be accidentally or deliberately manipulated by the people collecting the data. For example, participants may fear losing their benefits if they give negative answers to the person asking the question. Similarly, the collector may have had trouble in gaining access to the correct mix of participants. It is possible to check for this by taking a small sample of the results and re-validating the data (see the previous section).
Every data set contains outliers; data points that are so different from all the others that it really skews the results. These can be anomalies (one rich person living in a village) or may just be errors in data entry (entering a few extra “0s” to someone’s income). Going through the data set carefully and removing these is part the data analyst’s standard toolkit. However, it is important to make sure you are only reducing data noise, not changing the data to fit your expected outcome.
Correlation vs causation
Even if two variables might seem to be related, it doesn’t mean that one caused the other. The classic example used here is the correlation between the rise of crime rates and ice cream consumption during summer months in the US. The two variables are correlated, but neither causes the other - both are, in fact, linked causally to temperature, but not to each other.
Why throwing away some of the results might actually improve the accuracy of your data
If your data is derived from a sample population, you might have inadvertently picked one or two individuals that are way off the charts with some of the parameters, in such a way that you cannot generalise the results. For example, in measuring the results of an income generation project, you have three women who have incomes 3 times larger than all 200 others: including these would significantly change the results of your data and may have been caused by a simple data entry error.
If the data has been manually entered or been automatically collected, the outliers might also derive from measurement errors, or a typo.
Removing such data actually makes the remaining data more meaningful (and less noisy), and provides a more concrete and realistic data set.
Compare with other data and analysis:
Are there similar, comparable data collection efforts from other countries or groups? There are a number of resources online which can be useful data sources. For example, the IATI Registry.
Go back and ask:
Reach out to a small sample of the surveyed population for a more in-depth analysis. This requires that in your collection efforts you have the ability to take and securely store data on the people you survey in order to be able to contact them again in future (as long as it is safe to do so). If the initial group was part of a small qualitative research project, maybe you can scale up through a more quantitative questionnaire to support your first research.
Connect with experts in the field for opinion:
Experts working in the field you are doing research on might provide a valuable resource in knowing what your results actually mean, and whether there are gaps or blind spots in your research that you should address before starting the analysis.